Ecommerce analytics: four tools, four answers, and which to believe
Turning what your tools record into decisions you'd defend. The tricky part isn't the data. It's that every tool counts the same customer differently.
- 003Analytics
- The systematic computational analysis of data or statistics, used to understand and optimise business performance.
- Main sources
- Shopify for orders, Google Analytics for traffic, Klaviyo for email
- Why they disagree
- Each one credits a sale by its own rules and over its own window
- Done well
- Ends in a decision somebody actually makes, not in a dashboard
Every tool in your stack counts the same order differently
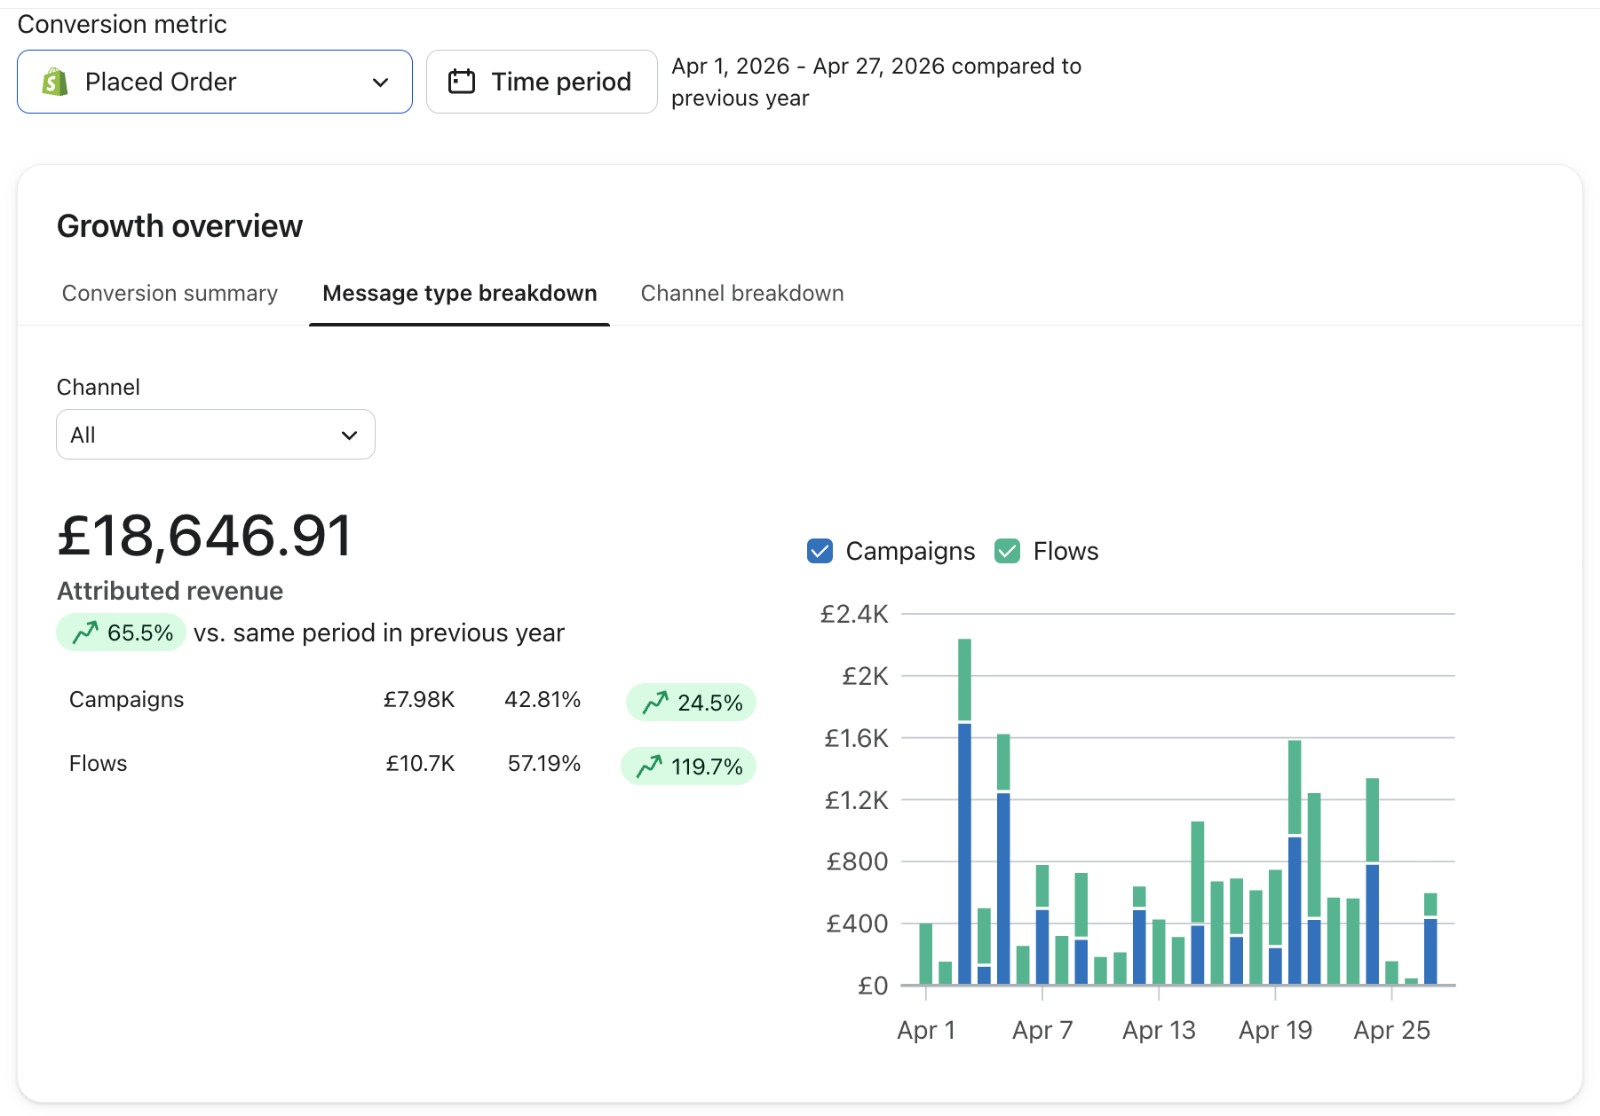
Shopify records the order. Google Analytics credits it to a traffic source by its own attribution rules. Klaviyo credits it to an email if somebody opened or clicked inside the attribution window. Your ad platforms each claim it as well. Add those claims together and you can easily get more revenue than the shop took.
| Question | Trust | Because |
|---|---|---|
| How much did we sell? | Shopify | It's the till. Everything else is a claim on it |
| Where did visitors come from? | Google Analytics | It's built to compare channels and pages side by side |
| Which email earned its keep? | Klaviyo | It knows who got which email, and when they bought |
| Is the ad worth the spend? | The shop's own orders, over time | Every ad platform marks its own homework |
The settings that quietly change every number
Most analytics arguments are settings arguments. The attribution window in Klaviyo, the attribution model in Google Analytics, a bot filter in Shopify, a date range that includes a sale last year didn't have. Change one and the history moves with it.
- Write the settings on every report: window, model, dates, filters
- Change them rarely, and note the day you do
- Read email's attributed revenue as a share of the shop's own total
- Compare against the same period last year as well as last month
Our post on the Klaviyo attribution window goes through the setting that moves email's number most.
Numbers tell you where, recordings tell you why
Reports tell you a product page loses people. They don't tell you why. Session recordings and heatmaps do: the size chart opened three times, the delivery cost found at the last step. That's where conversion rate optimisation starts, with what people did, not with what a dashboard averaged.
Then do something with it. A monthly read of a handful of numbers, each tied to a KPI somebody owns, beats a dashboard nobody opens. If a report never changes what you do next month, stop producing it.
Related terms
FAQs
Why don't Shopify and Google Analytics match?
They count different things. Shopify records every order the shop takes. Google Analytics misses visitors who decline cookies or block tracking, and credits sales by its own attribution rules. A steady gap is normal. A gap that suddenly widens usually means tracking broke or consent settings changed.
Do I need Google Analytics if I already have Shopify and Klaviyo?
It earns its place for comparing channels, landing pages and site behaviour in more depth than Shopify's own reports go. If orders and revenue are all you need, Shopify covers it. If you do use it, set it up properly once, or it'll mislead you for years.
What should a monthly analytics review cover?
A handful of numbers, read the same way every month: revenue from the shop, email's share of it, conversion rate by traffic source, revenue per recipient, and the second order rate for new customers. Add one line on what changed that month, so next year's comparison makes sense.
Rather we explained it on your own account?
Bring your Klaviyo account to a growth consultation. We'll walk through what this means for your numbers, in plain English, and what we'd fix first.


Half an hour with Theo, our founder.
We're all about relationships built on trust, mutual respect and a shared vision for success. If that sounds like your vibe, let's make some waves together 🌊