Revenue per recipient is the number worth watching
Total revenue rewards sending to everybody. Open rate stopped meaning much in 2021. Per recipient is the one that survives both.


Divide the revenue a send earned by the number of people who got it. That's the whole calculation. It's the only common email number that punishes you for mailing people who didn't want it, and it flatters flows in a way almost nobody admits to.
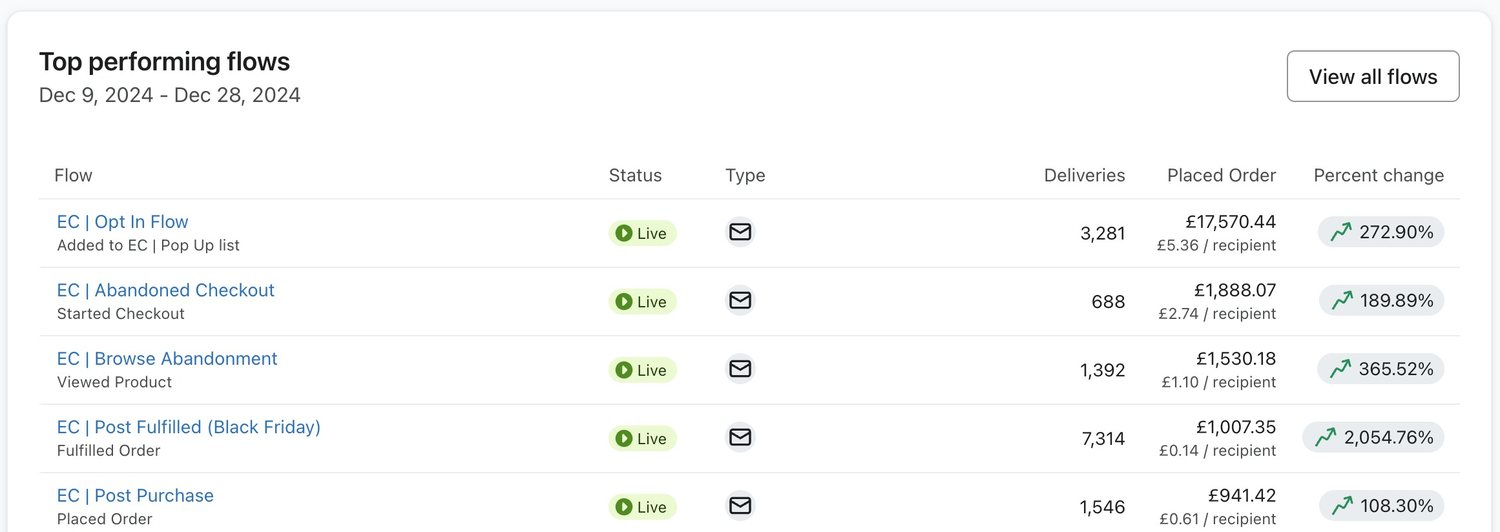
What revenue per recipient is measuring
Attributed revenue on top, the people who got the send underneath. Klaviyo prints it under the revenue figure on any flow or campaign, so you rarely have to work it out yourself. It's also the line most reports scroll straight past.
What makes it useful is what it refuses to reward. Send to a much wider audience for the same effort and your total revenue rises while this number falls. That's the exact trade the revenue headline hides from you.
It also makes two unlike things comparable. A flow message and a Friday campaign share no audience size and no purpose, but you can ask both the same question: what did this earn from each person it interrupted.
Why it beats the open rate now
Let's face it, open rate has been broken for years. Apple's Mail Privacy Protection loads images for people who never opened anything, so the number is a mix of readers and machines in a proportion nobody can tell you. Revenue per recipient is made of orders, and machines don't place orders.
Open rate still works as a relative signal on one audience over time. It stopped being a number to plan around. And if any of the vocabulary here is new, the glossary carries the rest of it.
Flows will always win, and it proves less than you think
Every account we've ever opened shows the same shape. Flow sends earn multiples of what campaign sends earn per recipient. It isn't because the emails are better written.
The flow audience picked itself. Somebody abandoned a checkout, ran out of a product or came back to a category, and the email arrived because of it. You can't copy that advantage onto a campaign by writing harder. It's why the flow library get built before the calendar does.
So we read a low campaign figure as a brief, not a verdict. If your campaigns earn little per recipient, the answer is almost always a narrower audience and a better reason to send. Not another pass at the template.
The per recipient figure on the summary card is an average of everything
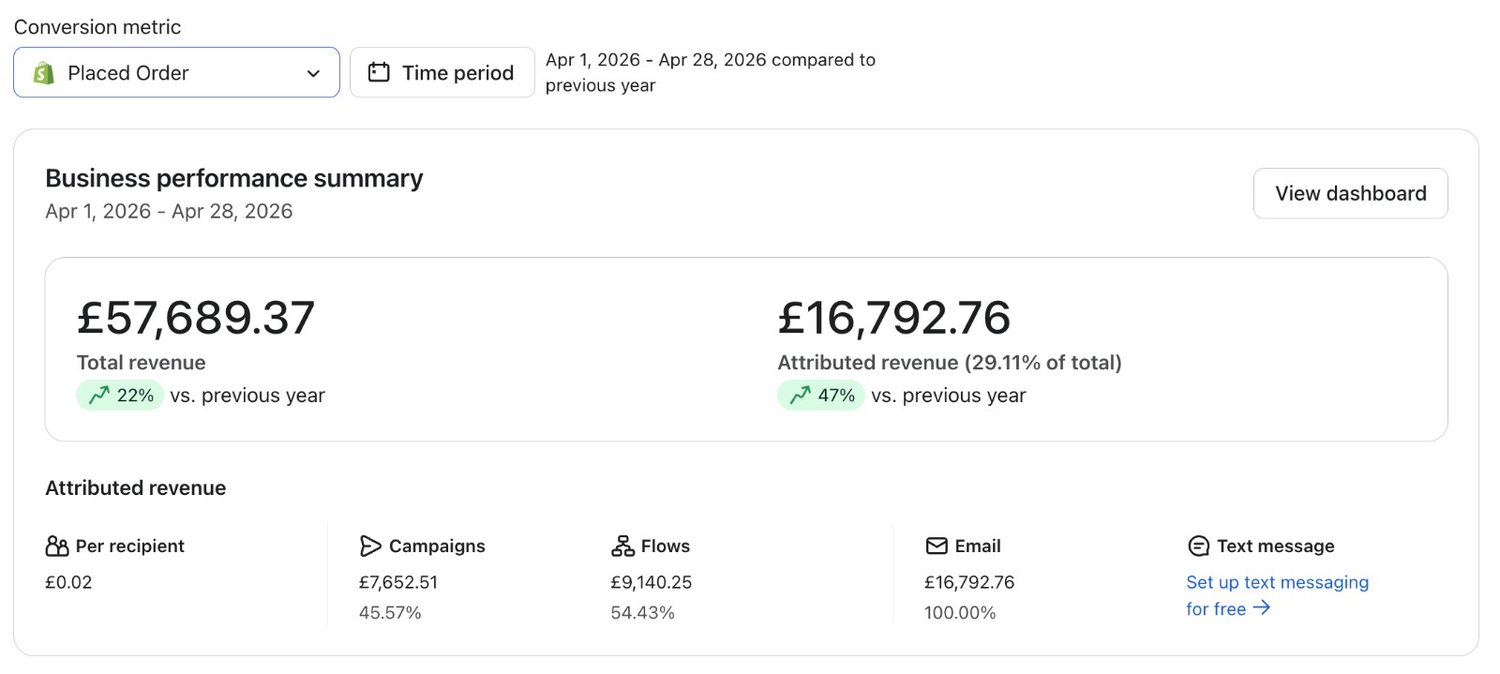
That per recipient line covers every send in the period. One large campaign to the whole file drags it down in a month the business did well. Read it per send or per flow, and keep the account level figure for comparing a period against the same period last year.
How to use it without fooling yourself
- Compare it against your own last quarter, never against a benchmark from a brand with a different basket size
- Compare campaigns with campaigns and flows with flows, because the two aren't competing for the same job
- Watch it alongside unsubscribes and complaints, which is where the cost of a wide send shows up
- Remember it inherits the attribution window, so changing the window changes the number without changing the business
- Track it per segment as well as per send, because one audience is usually carrying the average
- Look at it after every widening of an audience, which is when it moves most and gets checked least
One habit's worth more than the other five. Write the number down beside every send in a plain sheet, with a note on who got it. After a quarter you'll have something no benchmark can hand you: your own curve, for your own list, in your own category.
What a falling number is telling you
| What you see | Usually means | What to do about it |
|---|---|---|
| Per recipient falling, total revenue flat | The audience got bigger and colder | Cut the audience before you cut the calendar |
| Both falling | Placement or offer, not copy | Check complaints and inbox placement before rewriting subject lines |
| Flow per recipient falling | More people qualifying, not worse emails | Look at the entry rate first, and only then at the content |
| Per recipient rising, revenue falling | You're only emailing the faithful | Widen deliberately, in steps, watching complaints as you go |
The number isn't a target. It's a way of noticing that something changed in who you were talking to, usually a fortnight before the revenue chart admits it.
Check it after every change to a segment definition too. A rule that quietly widened last quarter is the commonest cause of a figure that's been drifting down for months with nobody able to say when it started.
Theo Tziapouras
Founder and strategy at Engage Commerce, the ecommerce agency for 7 and 8 figure DTC brands.
FAQs

How is revenue per recipient calculated?
Take the revenue attributed to a send and divide it by the number of people who received it. Klaviyo shows it under the revenue figure on flows and campaigns, and the same maths works on any platform that reports attributed revenue and delivery counts. No spreadsheet needed.
What is a good revenue per recipient?
There's no honest universal answer, because it moves with basket size, category and how often people buy. Your own last quarter is the only benchmark worth having. Anybody quoting you an industry figure is comparing your homeware brand to somebody selling supplements every month.
Why is my flow number so much higher than my campaign number?
Because flows reach people who just did something, and campaigns reach people who happened to be on the list that day. The gap is a fact about audiences, not about writing. Use it to decide what to build next, not to decide that campaigns are a waste of time.
Does a high figure mean I should be sending less?
Not on its own. A high number on a small audience usually means you're only emailing people who were going to buy anyway, and the growth is sitting in the segment you've been avoiding. Widen in steps, watch complaints as you go, and expect the number to dip while the total climbs.
Does revenue per recipient work for SMS?
Yes, and it matters more there, because every message has a real cost per person. Keep the two channels in separate reports though. A shared number hides the fact that one of them is billed by the send and the other by the size of the list.
Pick one number to argue about in the monthly meeting
If a retention report only had room for one figure, this would be ours. Total revenue tells you how busy the channel was. Open rate tells you how many images loaded. Revenue per recipient tells you whether the last send was worth the attention it borrowed. Watch it per flow, per campaign and per segment for a quarter and the arguments about how often to send tend to settle themselves, because the answer stops being an opinion.
Measurement and attribution
Which numbers are worth watching, and which ones flatter everybody who reports them.

Is email revenue incremental, or would those people have bought anyway
Attributed revenue is a credit system, not proof of cause. The difference is measurable, and most brands have never measured it.
Read it
Flow revenue vs campaign revenue: which one to fix first
One half is a machine that runs while nobody watches it. The other is a decision somebody makes every week. They fail differently.
Read it
Why is my open rate so high? Because Apple opened it for you
Apple's been opening your email for you since 2021. Here's what the biggest number on your report measures now, and what to trust instead.
Read itWould you rather this was just handled?
Bring your Klaviyo account and the thing annoying you most. We will tell you what we would fix first, before you spend anything.

Half an hour with Theo, our founder.
We're all about relationships built on trust, mutual respect and a shared vision for success. If that sounds like your vibe, let's make some waves together 🌊